View metrics
Kalix projects have a built-in dashboard as part of the Control Tower in the Akka Console. You can see metrics such as "requests per second", "replicas" of a service, or "commands received" by a component. Data is grouped into categories: Services, Event Sourced Entities, Value Entities, Views, Workflows, Consumers, Replication. The following shows a section of the dashboard. The content of the panels can be filtered using the filters at the top.
Categories
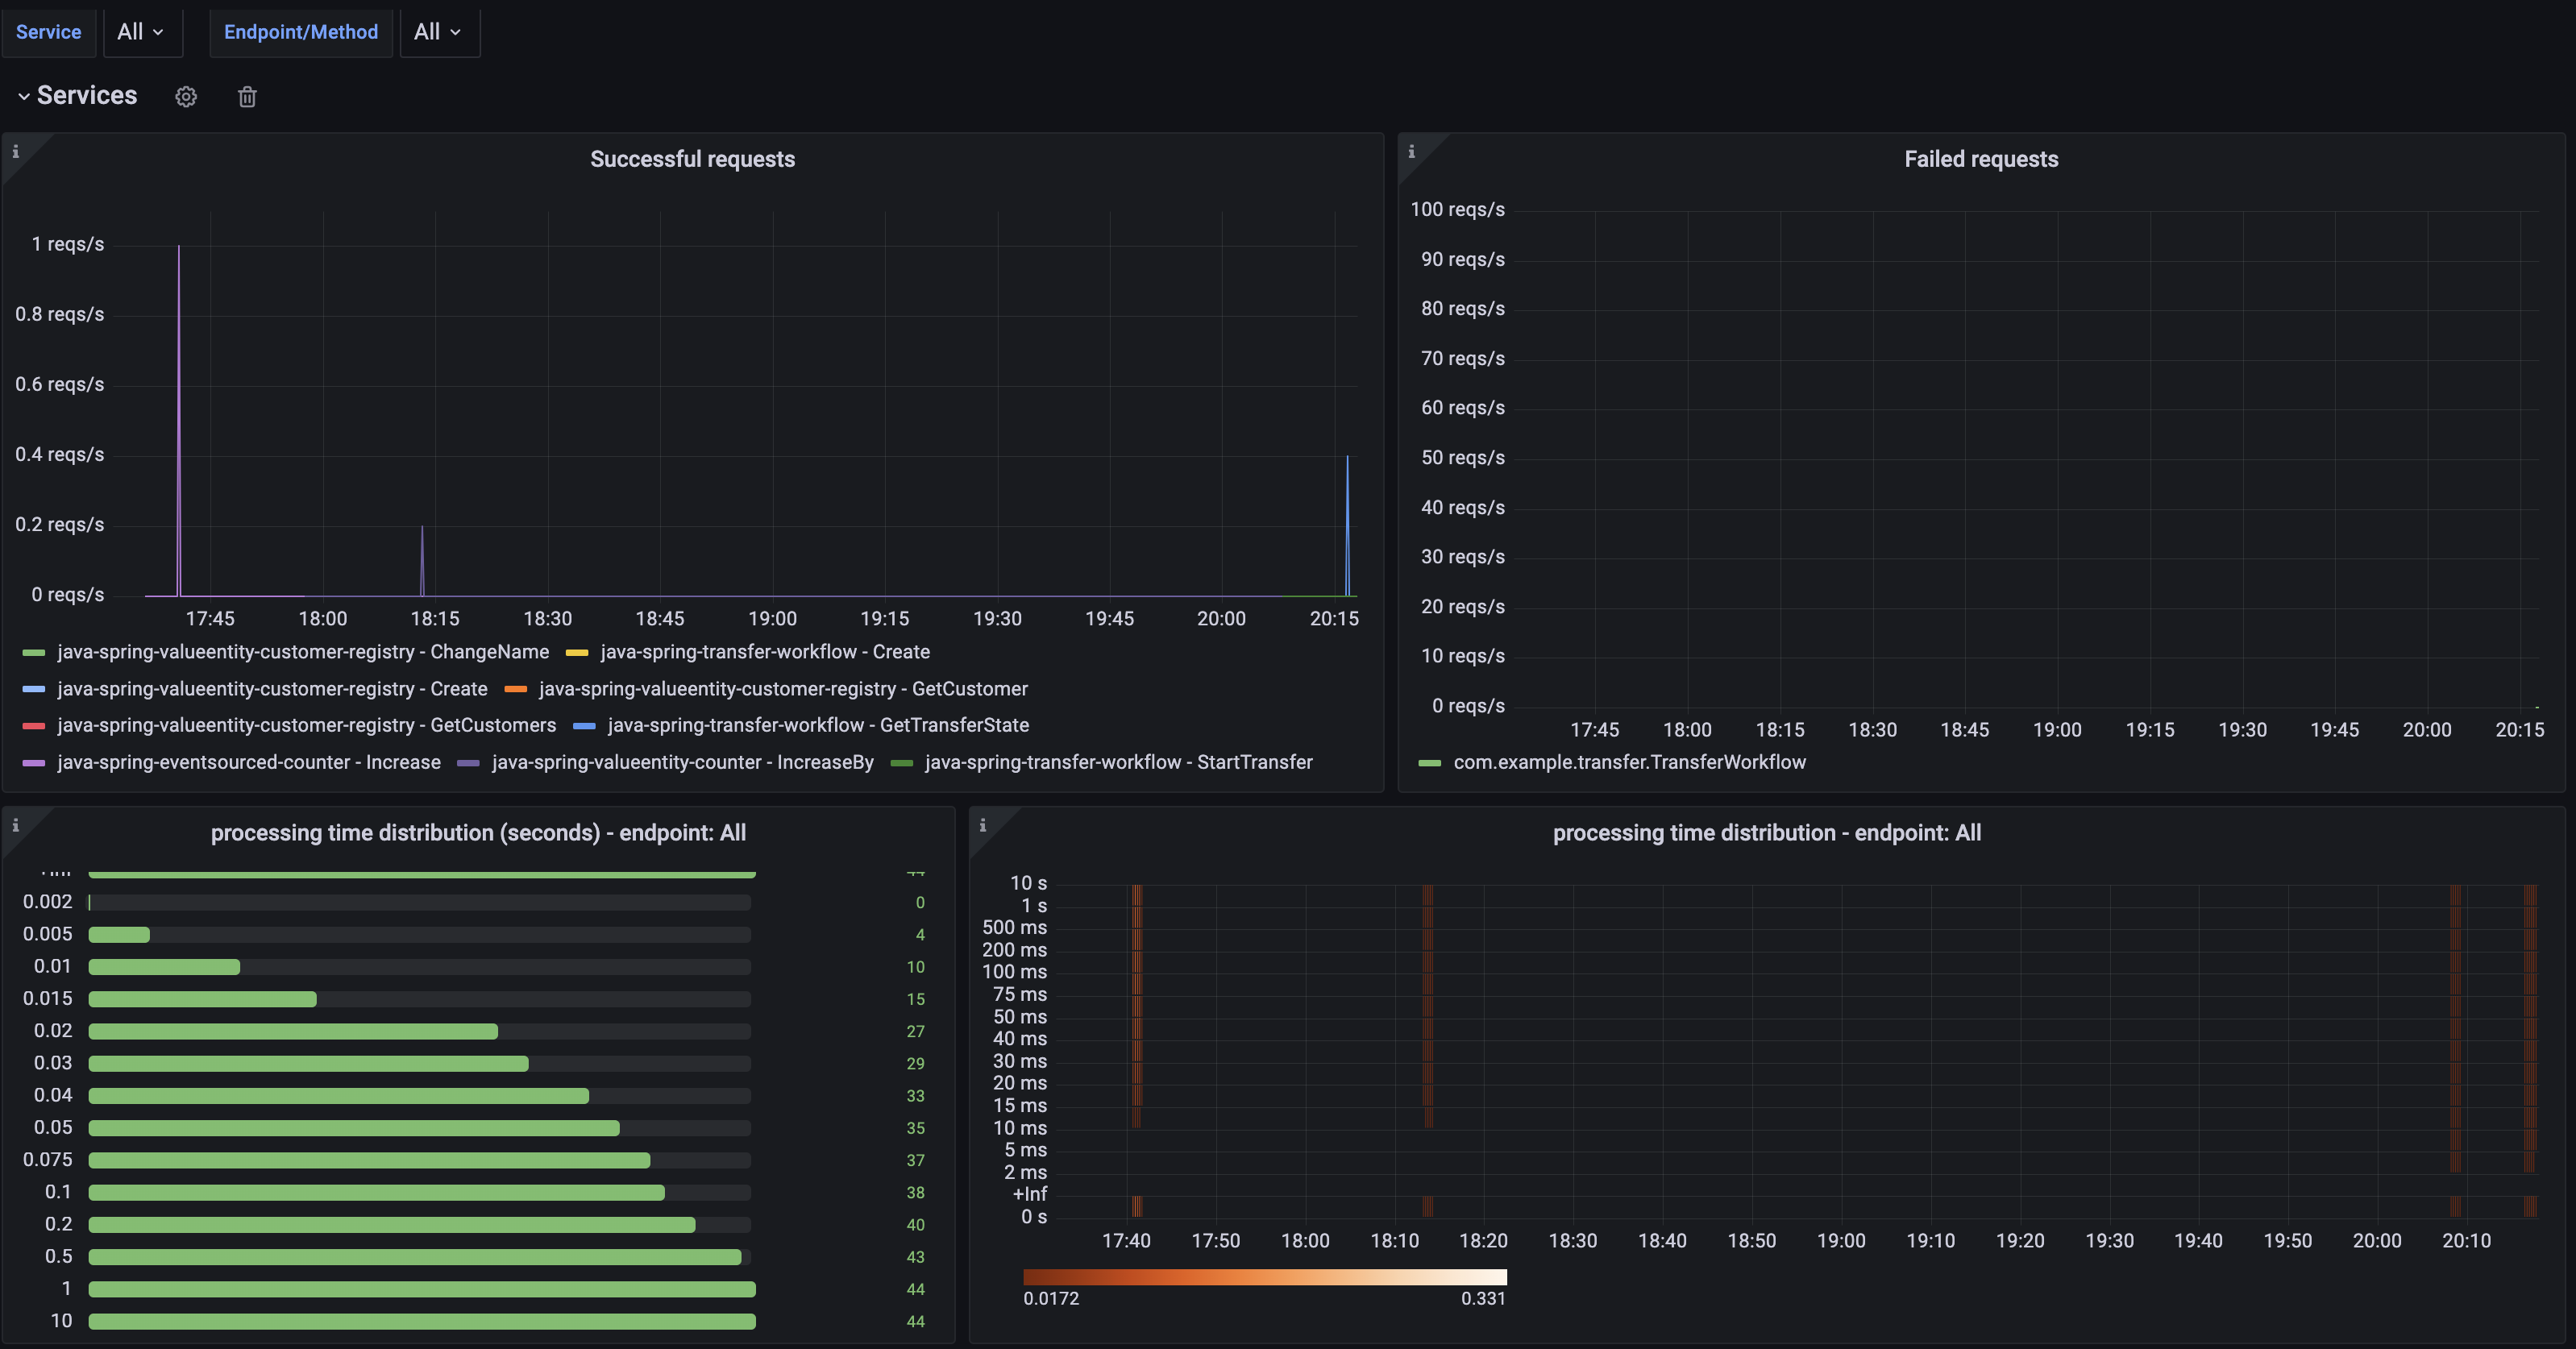
Services
Successful Requests: Rate of successful requests per second (reqs/s) over time, by endpoint.
Failed Requests: Rate of requests (reqs/s) that raised an error when processing the request, over time, by endpoint.
Processing time distribution(seconds): Number of requests grouped by processing duration, by endpoint.
Processing time 99p: 99th percentile of processing time, over time, by endpoint.
Processing time histogram: Number of calls that fall into each processing time bucket over time, by endpoint i.e., a histogram of processing time, over time.
Instances: Number of running instances of the service.
Version: A single number, always increasing, shows the service incarnation number. E.g. for a service deployed three times, the value would be 3.
Data ops (read/writes): Total number of reads from the DB by any Kalix component of the service(s) and endpoint(s)/method(s) selected. Total number of writes by any Kalix component of the selected service(s) and endpoint(s)/method(s) selected.
Event Sourced Entities
Commands received: Rate of commands received per second over time.
Stored events: Total number of events stored per second over time.
Data ops(reads/writes): Total number of reads when loading from the DB the latest snapshot and the events afterward. Total number of writes when persisting the events or the snapshots generated by the entity.
Processing time percentiles: 50th, 95th, and 99th percentiles for the processing time of the commands.
Value Entities
Commands received: Rate of commands per second over time.
Data ops(reads/writes): Total number of reads when loading its state from the DB. Total number of writes when persisting its state in the DB.
Processing time percentiles: 50th, 95th, and 99th percentiles for the processing time of the commands.
Views
Rows updated: Number of rows updated per second over time.
Query request received: Number of query requests received per second over time.
Average update size: Average size of each update. Calculated by dividing the total size of the update by the number of rows.
Average query result size: The average size of a query. Calculated by dividing the total size of the queries by the number of queries requested.
Workflows
Commands received: Rate of commands per second over time.
Data ops(reads/writes): Total number of reads when loading from the DB the latest snapshot and the events afterward. Total number of writes, by workflow, when persisting the events or the snapshots generated by the workflow.
Processing time quantiles: 50th, 95th, and 99th percentiles for processing time of the command.
Consumers
Events consumed: The processing rate of events consumed by a subscription.
Subscriptions failed: Failures consuming events from a Consumer or a View.
Events consumption lag - average: Average delay in consumption of events by a Consumer or a View.
Events consumption lag: 50th, 95th, and 99th percentiles on the delay in consumption of events by a Consumer or a View. Measured in wall-clock time.
Events processing time - average: Average duration for event processing (including user service and persist) by a Consumer or a View.
Events processing time: 50th, 95th, and 99th percentiles of the duration it takes a Consumer or a View to process events, including user service and persist.